Activity 2.4.8: Use of the TCP/IP Protocols and the OSI Model in Packet Tracer
Learning Objectives
- Explore how PT uses the OSI Model and TCP/IP Protocols
- Examine Packet Processing and Contents
Introduction:
In Packet Tracer simulation mode, detailed information about packets and how they are processed by networking devices may be viewed. Common TCP/IP Protocols are modeled in Packet Tracer, including DNS, HTTP, TFTP, DHCP, Telnet, TCP, UDP, ICMP, and IP. How these protocols are used by networking devices in creating and processing packets is displayed, in Packet Tracer, using a representation of the OSI Model. The term protocol data unit, or PDU, is a generic description of what are known as segments at the transport layer, packets at the network layer, and frames at the data link layer.
Task 1: Explore the PT interface
Step 1. Examine the Help Files and Tutorials
From the pull down menu, choose Help->Contents. A web page will open. From the left frame, choose Operating Modes->Simulation Mode. If not already familiar, read about simulation mode.Step 2. Switching from Realtime to Simulation Mode
In
the far lower right of the PT interface is the toggle between Realtime
and Simulation mode. PT always starts in Realtime mode, in which
networking protocols operate with realistic timings. However, a powerful
feature of Packet Tracer allows the user to "stop time" by switching to
Simulation mode. In Simulation mode, packets are displayed as animated
envelopes, time is event driven, and the user can step through
networking events. Click the Simulation mode icon to switch from Realtime mode to Simulation mode.
Task 2: Examine Packet Contents and Processing
Step 1. Creating a Packet and Accessing the PDU Information Window
Click the Web Client PC. Choose the Desktop tab. Open theWeb Browser. Enter the IP address of the Web Server into the browser, 192.168.1.254.
Clicking Go will initiate a web server request. Minimize the Web Client configuration window. Since time in simulation is event driven, you must use the Capture/Forward button to display network events. Two packets appear in the event list, one of which has an eye next to it. An eye next to a packet means it is displayed as an envelope on the logical topology. Find the first packet in the Event List, and click the colored square in the Info column.
Step 2. Investigating device algorithms in the OSI Modelview
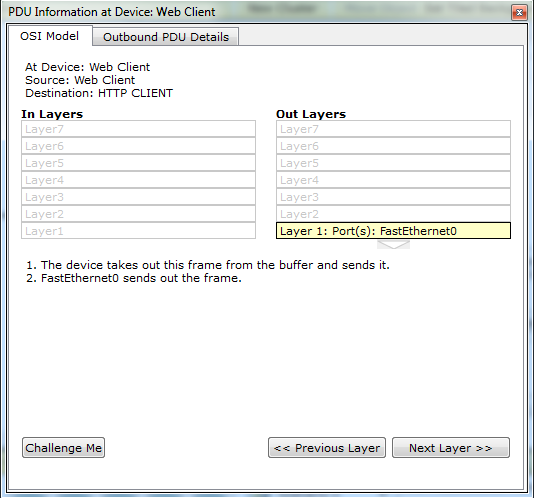
When you click the Info square for a packet in the event list, or if you click a packet envelope displayed on the logical topology, thePDU Information window opens.
The OSI model organizes this window. In the case of the first packet we are viewing, notice the HTTP request (at Layer 7) is then encapsulated, successively, at Layers 4, 3, 2, and 1. If you click through these layers, the algorithm used by the device (in this case, the PC) is displayed. View what is going on at each layer--this will be the subject of much of the rest of the course.
Step 3. Inbound and Outbound PDUs
When opening the PDU Information window, the default is the OSI Model view. Now click the Outbound PDU Details tab.
Scroll down to the bottom of this window.
There you will see that HTTP (the web page request that started this series of events) is encapsulated as data in a TCP segment, which in turn is encapsulated in an IP packet, which in turn is encapsulated in an Ethernet frame, which in turn is transmitted as bits on the medium.
If a device is the first device involved in a series of events, packets at that device will only have an Outbound PDU Details tab; if a device is the last device in a series of events, packets at that device will have only an Inbound PDU Details tab.
In general, you will see both Outbound and Inbound PDU details, which give details about how Packet Tracer is modeling that device.
Step 4. Packet tracing: animations of packet flow
The first time through a packet animation, you are actually capturing the packets, as in a protocol sniffer. Hence, theCapture/Forward button means "Capture" one set of events at a time. Step through the web page request. Note that you are only displaying HTTP-related packets; but other protocols like TCP and ARP also have packets that are not being displayed. At any time in your packet capture, you can open the PDU Informationwindow. Run through the entire animation until the "No More Events" message is reached. Experiment with this packet tracing process -- running the animation again, examining packets, predicting what will happen next, and investigating your predictions.


Bootstrap Studio features a stunning
BalasHapusCisco Packet Tracer crack 6/