Pencarian

Rabu, 16 April 2014

Cisco CCNA Exploration 4.0 Chapter4 PT 4.2.5


Activity 4.2.5: TCP Session Establishment and Termination

Learning Objectives

  • Setup and run the simulation
  • Examine the results

Introduction:

TCP is a connection-oriented protocol. Before information, such as a web page, can be exchanged, the peers must establish a connection. A connection is established by a three-way handshake where the initial sequence numbers for both peers are sent and acknowledged. When the exchange is complete, the peers exchange TCP segments to terminate the session properly. The previous activity focused on the actual exchange of TCP segments. This activity will focus on connection establishment before the exchange and session termination following the exchange.

Task 1: Setup and run the simulation

Step 1. Enter simulation mode

To verify the connection, click on the PC in the logical workplace. Open the Web Browser on the Desktop. Type 192.168.1.2 into the URL box and click the Go button.


The web page should appear. Click theSimulation tab to enter simulation mode.

 Step 2. Set Event List Filters

We want to capture only TCP events. In the Event List Filters section, click the Edit Filters button. Select only TCP events. TCP events include TCP based application protocols like HTTP and Telnet.


Step 3. Request a web page from the PC

Restore the web browser window. In the Web Browser, click the Go button to request that the web page be resent. Minimize the simulated browser window.
Step 4. Run the simulation
Click the Auto Capture / Play button. The exchange between the PC and the server is animated and the events are added to the Event List. These events represent the establishment of the TCP session, the PC's request for web page, the server sending the web page in two segments, the PC acknowledging the web page, and the termination of the TCP session. A dialog box appears indicating there are no more events. Click OK to close it.

Task 2: Examine the results

Step 1. Access specific PDUs

In the Simulation Panel Event List section, the last column contains a colored box that provides access to detailed information about an event. Click the colored box in the last column for the first event. The PDU Information window opens.

Step 2. Examine the contents of the PDU Information Window

In this activity, we will focus only on event information only at Layer 4. The first tab in the PDU Information window contains information about the inbound and outbound PDU as it relates to the OSI model. Click theLayer 4: boxes for both the inbound and outbound layers and read the content of the box and description in the box below the layers. Pay attention to the type of TCP segment. Click the Outbound PDU Details tab. In the TCP segment, note the initial sequence number.

Examine the PDU information for the first four TCP events in the same fashion. These events show the three-way handshake that establishes the session. Note the type of TCP segment and the change in the sequence number.

Examine the PDU information for the TCP events that follow the main HTTP exchange in the same fashion. These events show the session termination. Note the type of TCP segment and the change in the sequence number.

Note that if you use the Reset Simulation button in the Event List window, you will need to return to the web browser window and press Go to make a new request. 

Cisco CCNA Exploration 4.0 Chapter4 PT 4.1.6

Activity 4.1.6: UDP and TCP Port Numbers

Learning Objectives

  • Setup and run the simulation
  • Examine the results

Introduction:

UDP and TCP are TCP/IP Protocols that correspond to OSI Layer 4, the Transport layer. The PDUs for UDP and TCP differ substantially, but they share the notion of port numbers. Segments contain port numbers that identify the service the client is requesting from the server and port numbers generated by the client to which the server should reply. In addition to port numbers, the TCP segment also contains sequence numbers. Sequence numbers provide reliability by identifying missing segments and allowing the reassembly of the application data by putting the segments back together in the proper order.

Task 1: Setup and run the simulation

Step 1. Enter simulation mode

Click the Simulation tab to enter simulation mode.

 Step 2. Set Event List Filter


We want to capture only DNS and HTTP events. In the Event List Filters section, click the Edit Filters button and make sure only DNS and HTTP events are selected.

Step 3. From the PC, request a web page from the Server

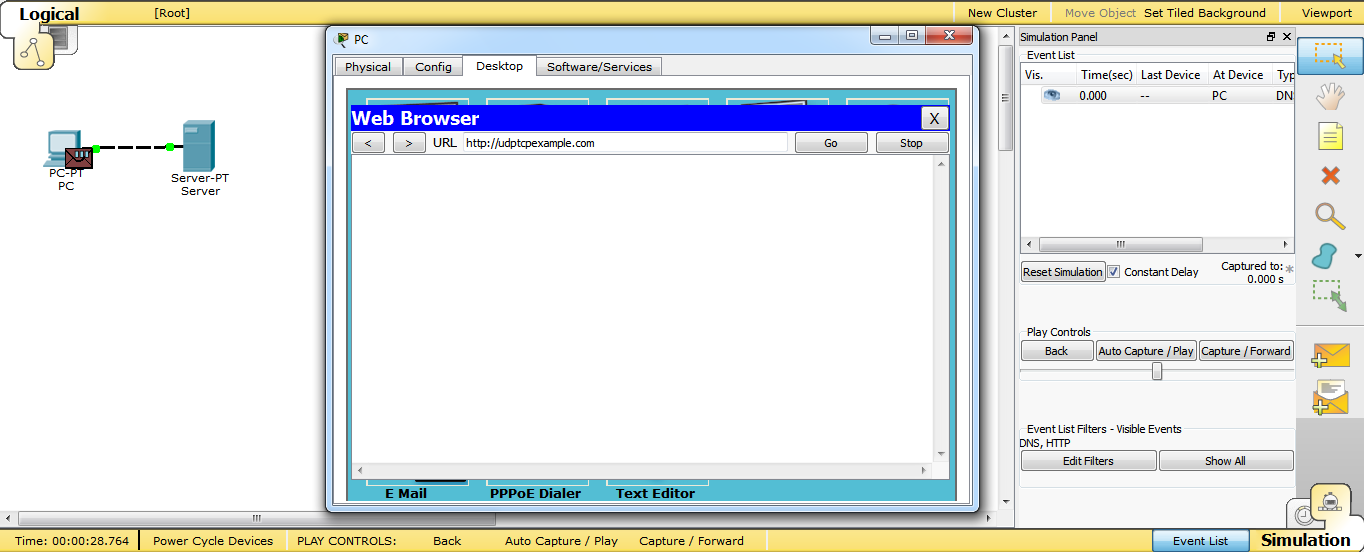
Click on the PC in the logical workplace. Open the Web Browser on the Desktop. Type udptcpexample.com into the URL box and click the Go button. Minimize the simulated browser window.
 
Step 4. Run the simulation
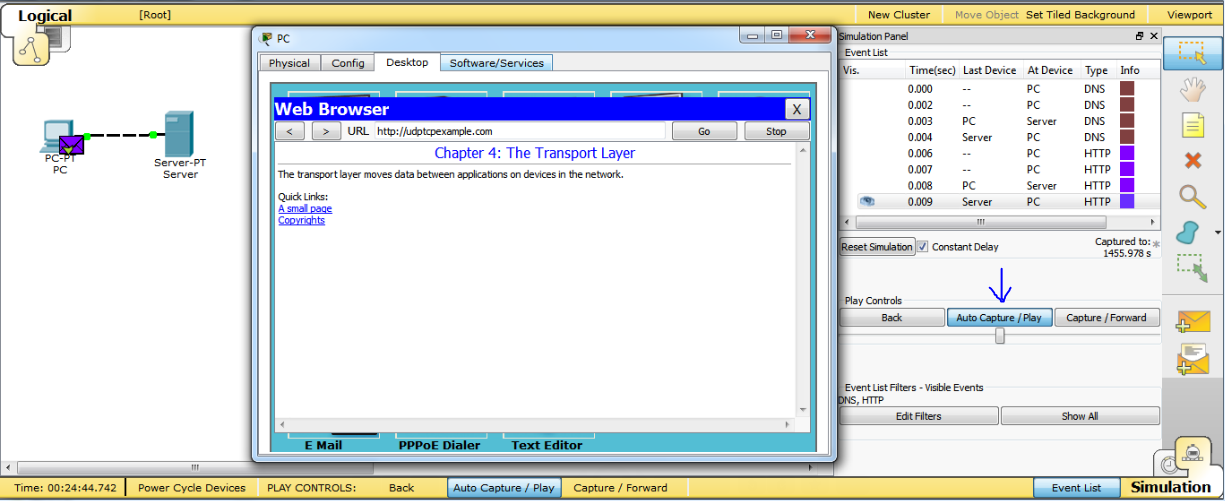
Click the Auto Capture / Play button. The exchange between the PC and the server is animated and the events are added to the Event List. These events represent the client PC's request for DNS service, followed by the request for a web page. The server sends the web page in two segments, and the PC acknowledges the web page. A dialog box appears indicating there are no more events to be captured. Click OK to close it.

Task 2: Examine the results

Step 1. Access specific PDUs

In the Simulation Panel Event List section, the last column contains a colored box that provides access to detailed information about an event. Click the colored box in the last column for the first event. The PDU Information window opens.


Step 2. Examine the contents of the PDU Information Window

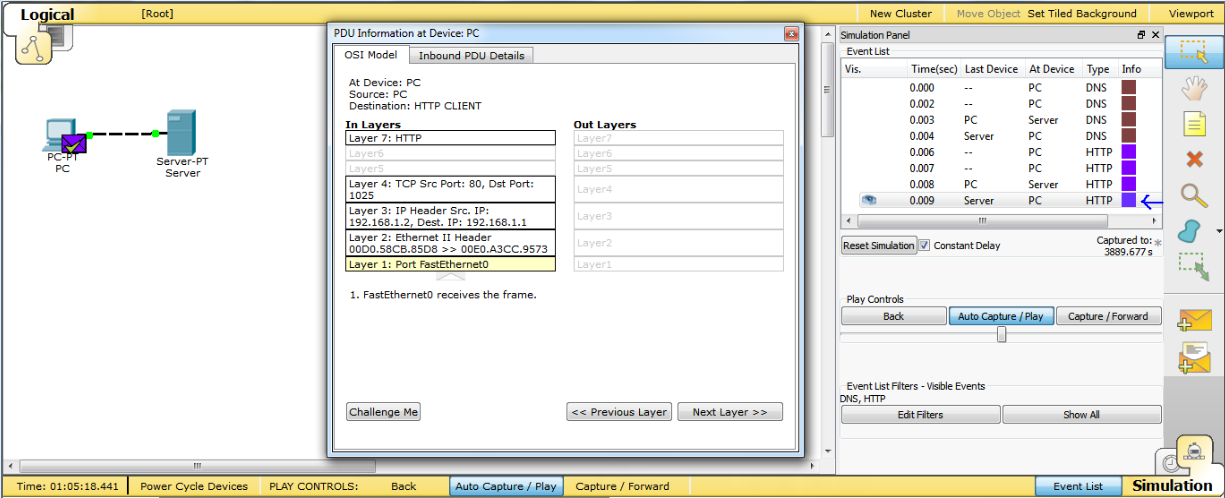
In this activity, we will focus only on event information only at Layers 4 and 7. The first tab in the PDU Information window contains information about the inbound and outbound PDU as it relates to the OSI model. Click the Layer 4: and Layer 7: boxes for both the inbound and outbound layers and read the content of the box and description in the box below the layers. Note that DNS uses UDP and HTTP uses TCP.


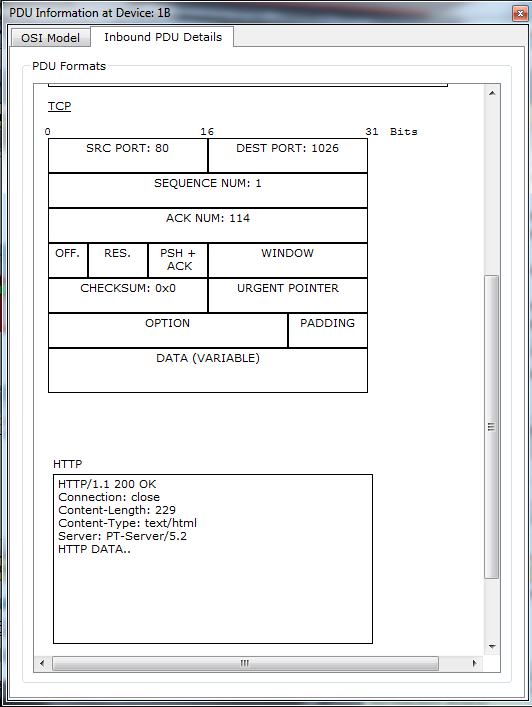
Pay attention to the port numbers. Port 53 represents DNS, the application protocol that associates domain names with IP addresses. Port 80 represents HTTP the application protocol that supports web pages. The other port is generated by the client PC from the range of port numbers greater than 1023. Click the Outbound PDU Details tab. In the TCP segment, note the initial sequence number.


Examine the PDU information for the other events in the same fashion. Note the change to the source and destination port numbers (for both UDP and TCP) and the change in the sequence number (for TCP only) as the next segment is delivered.

Note that if you use the Reset Simulation button, you must also return to the browser window and press Enter again to re-issue the web page request. This will allow you to re-capture and animate the DNS and HTTP-generated packets. 

Cisco CCNA Exploration 4.0 Chapter3 PT 3.5.1

3.5.1: Skills Integration Challenge-Configuring Hosts and Services

Topology Diagram:

Partial topology given; must be completed.

DeviceInterfaceIP AddressSubnet MaskDefault Gateway
R1-ISPFa0/0192.168.254.253255.255.255.0N/A
S0/0/010.10.10.6255.255.255.252
R2-CentralFa0/0172.16.255.254255.255.0.0N/A
S0/0/010.10.10.5255.255.255.252
S1-CentralVLAN 1172.16.254.1255.255.0.0172.16.255.254
PC 1ANIC172.16.1.1255.255.0.0172.16.255.254
PC 1BNIC172.16.1.2255.255.0.0172.16.255.254
Eagle ServerNIC192.168.254.254255.255.255.0192.168.254.253

Learning Objectives:

  • Configure Hosts and Services
  • Add, configure, and connect hosts and servers
  • Explore How DNS and HTTP Work Together
  • Use simulation mode to view the details of packets generated by DNS and HTTP

Background:

Throughout the course, you will be using a standard lab setup created from actual PCs, servers, routers, and switches to learn networking concepts. At the end of each chapter, you will build increasingly larger parts of this topology in Packet Tracer.

Task 1: "Repair" and Test the Topology

Add a PC with a display name of "1B" (without quotes) to the topology.


Configure it with the following settings: IP Address 172.16.1.2, Subnet Mask 255.255.0.0,
Default Gateway 172.16.255.254, and DNS Server 192.168.254.254.

Connect PC 1B to the Fa0/2 port of the S1-Central switch. 
Connect the Eagle Server to the Fa0/0 port on the R1-ISP router. 


Turn on web services on the server by enabling HTTP. Enable DNS services and add a DNS entry that associates "eagle-server.example.com" 

(without quotes) with the IP address of the server. Verify your work using feedback from the Check Results button and the Assessment Items tab.
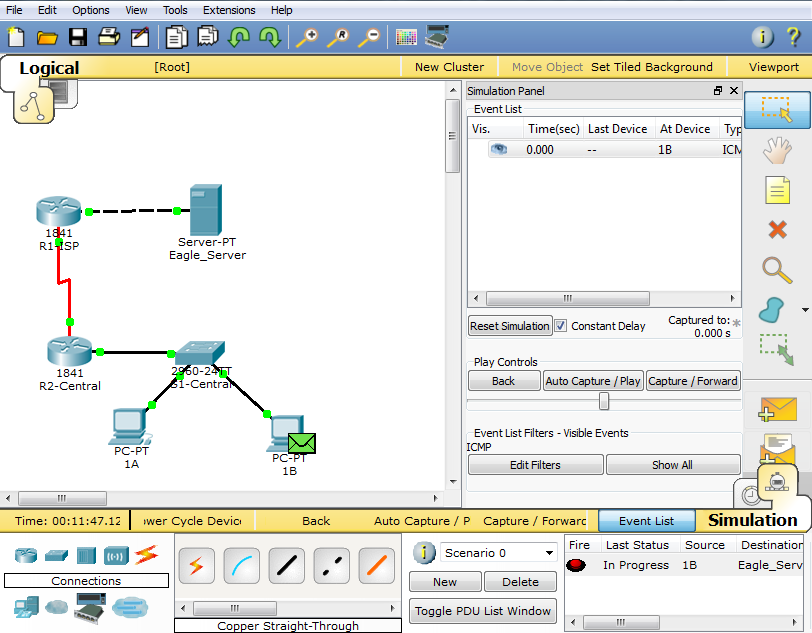
Test connectivity, in realtime, by using ADD SIMPLE PDU to test connectivity between PC 1B and the Eagle Server. 
Note that when you add a simple PDU, it appears in the PDU List Window as part of "Scenario 0". The first time you issue this one-shot ping message, it will show as Failed--this is because of the ARP process which, will be explained later. Double clicking the "Fire" button in the PDU List Window, send this single test ping a second time. This time it will be successful.
In Packet Tracer, the term "scenario" means a specific configuration of one or more test packets. You can create different test packet scenarios by using the New button--for example Scenario 0 might have one test packet from PC 1B to Eagle Server, Scenario 1 might test packets between PC 1A and the routers.

You can remove all test packets in a particular scenario by using the Delete button. For example, if you use the Delete button for Scenario 0 the test packet you just created between PC 1B and Eagle Server will be removed--please do this prior to the next task.

Task 2: Explore How DNS and HTTP Work Together

Switch from Realtime to Simulation mode. Open a web browser from the desktop of PC 1B.Type in "eagle-server.example.com"
(without quotes) into the Address Bar, press Enter, and then use the Capture / Forward button in the Event List to capture the interaction of DNS and HTTP. 
Play this animation and examine the Packet contents (PDU Information Window, Inbound PDU Details, Outbound PDU Details


for each event in the event list, especially when the packets are at PC 1B or at the Eagle Server. If you receive a "Buffer Full" message, click the View Previous Events button.

While the processing of the packets by the switch and the routers may not make sense to you yet, you should be able to see how DNS and HTTP work together.

Reflection:

Can you now explain the process that occurs when you type a URL into a browser and a web page returns? What types of client-server interactions are involved? 
If you have not already done so, you are encouraged to obtain Packet Tracer from your instructor and complete My First PT Lab (choose the HELP Pulldown Menu, choose CONTENTS). 

Cisco CCNA Exploration 4.0 Chapter3 PT 3.3.2

Activity 3.3.2: Network Representations

Addressing Table:

This Lab does not include an Addressing Table.

Learning Objectives:

  • Configure services and support
  • Configure DNS and HTTP on a server
  • Configure DNS support on a PC
  • Verify Connectivity in Realtime Mode
  • View how DNS and HTTP work together using Simulation Mode  

Introduction:

In this activity, you will configure a Server to provide DNS services and to host a web page, configure a PC to use DNS services, and view how DNS and HTTP work together.

Task 1: Configure services and support

Step 1. Configure DNS on the Server.

Click the Server. The server configuration window opens, Click the Config tab. The Global Settings appear. Click the button on the left for DNS. Verify the service is On. Set the Domain Name to www.example.com and the IPAddress to 192.168.1.254. Click the Add button. Additional domain names can be added in this fashion.

Step 2. Configure HTTP on the Server.

Click the button to select HTTP. Turn the service On. The Default Page Content window contains the page that is displayed when a web page is requested from the server. This page is in HTML format. This page can be changed if you would like to customize it. Close the server configuration window.
Step 3. Configure DNS support on the PC labeled Client
Click the PC Client. The PC configuration window opens, Click the Config tab. The Global Settings appear. Set the DNS Server to 192.168.1.254, the IP address on the Server. Close the PC configuration window.

At the end of this task your completion rate should be 100%.

Task 2: Verify Connectivity in Realtime Mode

Step 1. Ping the server using the URL.

Select the PC and click the Desktop tab. Click the Command Prompt button. A Command Prompt window opens. Type ping www.example.com (the URL of the Server) and press Enter. After the ping succeeds, close the Command Prompt window.

Step 2. From the PC, Open a Web Page.

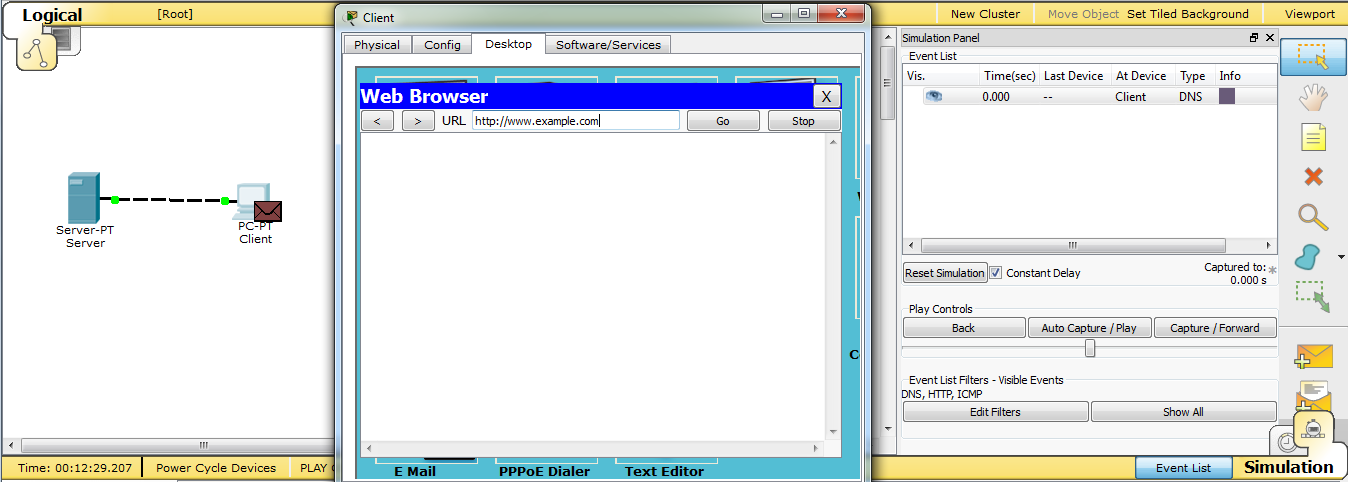
From the PC desktop, click the Web Browser button. A simulated web browser opens. Type www.example.com (the URL of the Server) into the URL box and click the Go button. A web page should appear. Close the PC configuration window.

Task 3: View how DNS and HTTP work Together using Simulation Mode

Step 1. From the PC, ping the Server using the URL

Enter Simulation mode. Click the PC Client. The PC configuration window opens. Click the 
Desktop tab. Click the Command Prompt button. A Command Prompt window opens. Type ping www.example.com (the URL of the Server) and press Enter

Minimize the simulated Command Prompt window. Use Capture/Forward to view the DNS and ICMP packets on the network. Each time you click the Capture/Forward button, 

the packet transfer process will proceed. During this process, you can click the colored square in the Info column to open the PDU information and view encapsulation and device processing details. 

Close the Command Prompt window; click the Reset Simulation button. 

Step 2. From the PC, open a web page on the Server using the URL

Click the Web Browser button. A simulated web browser opens. Type www.example.com (the URL of the Server) into the URL box and click the Go button.
Minimize the simulated browser window. Use Capture/Forward to examine the DNS and HTTP packets. 

For each packet in the event list, click the colored square in the Info column to open the PDU information and view encapsulation and device processing details.

Cisco CCNA Exploration 4.0 Chapter3 PT 3.2.3

Activity 3.2.3: Client-Server Interaction

Learning Objectives

  • Setup and run the simulation
  • Examine the results

Introduction:

Clients, such as desktop PCs, request services from servers. The course lab environment, using actual PCs and servers, supports a full range of services. In a simulated environment, the number of services is limited. Packet Tracer allows the addition of simulated network servers that support DHCP, DNS, HTTP, and TFTP. Packet Tracer also supports the addition of simulated PCs that can request these services. This activity uses a simple network consisting of a PC connected directly to a server configured to supply DNS services and hosting a web page. The activity will track the flow of traffic when a web page is requested, the IP address of the web page is resolved and the web page is delivered.


Task 1: Setup and run the simulation


Step 1. Enter simulation mode

When Packet Tracer starts, it presents a logical view of the network in realtime mode. At the end of the yellow bar below the logical workplace is the Realtime tab.

Behind and to the right of the Realtime tab is theSimulation tab. Click this tab to enter simulation mode. 

Step 2. Set Event List Filters

In simulation mode, the default is to capture all events supported by Packet Tracer. You can limit what is captured by setting event list filters. We want to capture only DNS and HTTP events. In the Event List section, click the Edit Filters button. A list of available events is displayed with all of them selected. Select the check box Show All/None in the lower right. This will clear all of the checked boxes. Select the check box for DNSand HTTP to select only DNS and HTTP events. Click outside of the events window to close it. The Event List will now display only DNS and HTTP events when running the simulation.

Step 3. Request a web page from the PC

Packet Tracer provides simulated services on devices. You will open a simulated web browser on the PC and request a web page from the server.

Click the PC in the logical workspace. Click the Desktop tab and click the Web Browser button. A simulated web browser opens. Type www.example.com into the URL box and click the Go button to the right. Minimize the simulated browser window.

Step 4. Run the simulation

In the Play Controls section of the Simulation Panel, click the Auto Capture / Play button. The exchange between the PC and the server is animated and the events are added to the Event List.
These events represent the request of the PC to resolve the URL to an IP address. The DNS server provides the IP address, upon the request for the web page from the PC. The server renders the web page in two segments, and the PC acknowledges the web page. A dialog box appears indicating there are no more events and provides information on the timing of the simulation. Click OK to close it.

Task 2: Examine the results

Step 1. Access a specific PDU

Restore the simulated browser window on the PC. Notice there is a web page displayed. Minimize the simulated browser window.
In the Simulation Panel Event List section, the Info column contains a colored box that provides access to detailed information about an event. Click the colored box in the Info column for the first event. The PDU Information window opens.
Step 2. Examine the contents of the PDU Information Window
The first tab in the PDU Information window contains information about the inbound and outbound PDU as it relates to the OSI model. Click the Next Layer >> button

repeatedly to cycle through the inbound and outbound layers and read the description in the box below the layers to get an overview of how the exchange works.
Examine the PDU information for the other events to get an overview of the entire exchange process.

If you have additional questions about the exchange process, be sure to ask your instructor. 

Rabu, 09 April 2014

Cisco CCNA Exploration 4.0 Chapter2 PT 2.7.1

Paket Tracer Exploration 2.7.1


2.7.1: Skills Integration Challenge-Examining Packets

Topology Diagram:

A nearly complete standard lab topology is provided as starting point.

DeviceInterfaceIP AddressSubnet MaskDefault Gateway
R1-ISPFa0/0192.168.254.253255.255.255.0N/A
S0/0/010.10.10.6255.255.255.252
R2-CentralFa0/0172.16.255.254255.255.0.0N/A
S0/0/010.10.10.5255.255.255.252
S1-CentralVLAN 1172.16.254.1255.255.0.0172.16.255.254
PC 1ANIC172.16.1.1255.255.0.0172.16.255.254
PC 1BNIC172.16.1.2255.255.0.0172.16.255.254
Eagle ServerNIC192.168.254.254255.255.255.0192.168.254.253

Learning Objectives:

  • Complete the Topology
  • Add Simple PDUs in Realtime Mode
  • Analyze PDUs in Simulation Mode
  • Experiment with the model of the standard lab setup

Background:

Throughout the course, you will be using a standard lab setup created from actual PCs, servers, routers, and switches to learn networking concepts. In this activity, you will continue learning how to build and analyze this standard lab topology. If you have not done so already, you are encouraged to examine the Help files available from the Help Pull-down menu at the top of the Packet Tracer GUI. Resources include a "My First PT Lab" to help you learn the basic operation of Packet Tracer, tutorials to guide you through various tasks, and information on the strengths and limitations of using Packet Tracer to model networks.


This activity will provide an opportunity to explore the standard lab setup using Packet Tracer simulator. Packet Tracer has two file formats it can create: .pkt files (network simulation model files) and .pka files (activity files for practice). When you create your own networks in Packet Tracer, or modify existing files from your instructor or your peers, you will often use the .pkt file format. When you launched this activity from the curriculum, these instructions appeared. They are the result of the .pka, Packet Tracer activity file format. At the bottom of these instructions are two buttons: Check Results (which gives you feedback on how much of the activity you have completed) and Reset Activity (which starts the activity over, if you want to clear your work or gain more practice).

Task 1: Complete the Topology
mr3

Add a PC to the workspace.


MR3

Configure it the following parameters: IP Address 172.16.1.2, Subnet Mask 255.255.0.0, Default Gateway 172.16.255.254, DNS Server 192.168.254.254, Display Name "1B" (do not include the quotation marks). 

MR3

Connect PC 1B to the Fa0/2 port of the S1-Central Switch and check your work with the Check Results button to see that the topology is complete.

MR3

Task 2: Add Simple PDUs in Realtime Mode

Wait until the switch link lights are green. Using the Add Simple PDU,


MR3

send a test message between PC 1B and Eagle Server. Note that this packet will appear in the lower right as a user created PDU that can be manipulated for testing purposes. The first time you issue this one-shot ping message, it will show as Failed--this is because of the ARP process, which will be explained later. Double clicking the "Fire" button in the PDU List Window, send this single test ping a second time. This time it will be successful. Please do this prior to the next task.

Task 3: Analyze PDUs in Simulation Mode (Packet Tracing)

Switch to simulation mode. Use the Capture / Forward button to move the packet through the network.
MR3
Click on the packet envelope, or on the colored square in the Info column of the Event List, to examine the packet at each step in its journey. 

Task 4: Experiment with the model of the standard lab setup

The standard lab setup will consist of two routers, one switch, one server, and two PCs. Each of these devices is pre-configured. Try creating different combinations of test packets and analyzing their journey through the network.

Reflection:

If you have not already done so, you are encouraged to obtain Packet Tracer from your instructor and complete My First PT Lab (available by using the HELP Pulldown Menu and choosing CONTENTS).